2010 Site Updates
Some links and images are no longer available in our older site updates. Additionally, some information is no longer applicable.
For the latest site updates, click here.
For the latest site updates, click here.
November 16th, 2010
I made a small update to the model system. It was administrative. It was now something on the public side of things, but it could make it buggy in some way, though I doubt it. It basically just allows me to create historic data a little easier.
One thing I did do was create a lite version of my model script for media organizations and researchers. You can read more about it on the media page. It uses a part of the new alpha system to create just model data for Google Earth. Nothing else. It is quite easy to run the CGI script. It does not however do things automatically. For that reason, I have made it completely public. This means someone cannot use it to put stress on the NOAA server but can for data they want allow them to process it themselves on their own computer. That means if this site is down and they have that script, all they need to do is download the best track and model file from the ATCF system and add it to a folder on their own computer to get the Google Earth model data by simply running the script on their computer. (Anyone can do that on a Windows computer, you just need to download and install Apache and then Perl.)
One thing I did do was create a lite version of my model script for media organizations and researchers. You can read more about it on the media page. It uses a part of the new alpha system to create just model data for Google Earth. Nothing else. It is quite easy to run the CGI script. It does not however do things automatically. For that reason, I have made it completely public. This means someone cannot use it to put stress on the NOAA server but can for data they want allow them to process it themselves on their own computer. That means if this site is down and they have that script, all they need to do is download the best track and model file from the ATCF system and add it to a folder on their own computer to get the Google Earth model data by simply running the script on their computer. (Anyone can do that on a Windows computer, you just need to download and install Apache and then Perl.)
October 21st, 2010
After five months of working full time on the new model system I have completed the major updates I planned on making this year. For the next 7 or 8 months I will be working on a different project unrelated to this site. Around the start of the 2011 hurricane season I will continue work on the new model system. I will be making any needed updates on this site as needed until then.
The last update I made to the new model system was the new center fix system. I will post more about it once it gets tested some more. It takes center fixes from the "fix" folder in the ATCF system and processes it for display on a Google map or in Google Earth.
The last update I made to the new model system was the new center fix system. I will post more about it once it gets tested some more. It takes center fixes from the "fix" folder in the ATCF system and processes it for display on a Google map or in Google Earth.
October 7th, 2010
Despite not posting any updates in the past month, work has continued on the the new model system and there has also been improvements to the recon system. The recon system now has the option to view mission data within your browser using the Google Earth plugin. While I have also worked on the model system, most all of the work involves something not related to models but to something else in the ATCF system. The new feature is currently being alpha tested offline and will likely not be available for a few more weeks to the public. The new model system itself has been working fairly well, though there are problems at times when an invest is upgraded. Sometimes the invest data sticks around when it should not.
September 7th, 2010
Update: It turns out the entire "tcweb" directory in the ATCF system is not working. It was not just a case of 91L's model data coming out first. This means I need to go redesign things to take care of another error that the NHC has. Only this one I cannot easily bypass. I have no idea how complex the redesign might need to be for the new model system. The old system works at the moment, but parts will eventually fail if the error is not fixed. It's the new system, based around the "tcweb" directory, that has the most issues at the moment. Hopefully the NHC will fix the error soon. I don't even know if I can easily redesign the new system. The old system I am not touching until it starts failing.
Work continues on the new model system. The system is getting somewhat more stable, though problems still seem to exist when a storm is upgraded from an invest to a depression or higher. Sometimes invest data is recreated when it should not be since the area was upgraded. Some updates to the code seem to have caused this new problem. I did make some changes but I am not confident that those changes will fix the problem.
I have been working on a new feature for the model / best track system that I have not finished yet. Maybe in a few weeks I will have the new feature running.
I noticed today that for 91L we have one of those rare instances where model data is released before best track data on a new invest. That is an unusual circumstance. The old model system is displaying the data since its primary focus is on the model directory. The new model system will not until best track data is released. While I could design the new model system to also look at the model directory, I don't think it is worth it to check that directory as well. While it would be nice to have the models for 91L if we did not have the old model system running, the models would not be extremely important or else the NHC would have realized a best track file was not released and fixed it. The most someone should have to wait is 6 hours when it would be time for the NHC to do another best track update and then realize the error. It is not worth using extra resources to check the model directory for this rare error.
August 17th, 2010
Work continues on the new model system. There are various small updates being made here and there. There is not anything big left to add, it is now a lot about improving the interface and fixing errors. I still have a list of things to do, but there are no major additions.
August 13th, 2010
Minor improvements continue with the new model system. Some navigation tweaks, a page with a listing of most models, Google Maps model pages and model error tables now have model names popup when you hover your mouse over a model, and seasonal Google Maps with all storms from the season on it are the latest features. I still have some things to add probably and of course code cleanup, but the system is coming along.
August 10th, 2010
A lot of changes were made in the past few days to the new model system. The wind and pressure diagrams were updated to go through 7 days. I also redesigned how they work due to an error when there is a lot of data. That is now fixed. The model error feature is currently available now for public testing, though error data on current storms active as of when I made the recent changes will not be available until after the storm ends. Anything that forms from now on should be available, unless I make additional changes to the file structure. I am going through my todo list to see what else I have to add to the system. I need to test the model error feature more. I also need to do some code cleanup and try to make it run a little better. Then, it is all about testing. I can't think of a whole lot left to add to the new model system in terms of the public appearance. There are some administrative things I might need to add.
August 6th, 2010... Work on the model error feature is nearing completion and is nearly ready to be tested publicly
The model error feature appears to be working as it should. However, the model error feature is very complex. It will need a lot of testing before the data can come anywhere close to being trusted. I am in the process of writing the product description page. That page will eventually explain, in exhaustive detail, how the feature works. It is a very important page because data that is created on our site after a storm was active will not match the data had it been processed in real time on our site. (except for the final average run for the storm, which should match up unless model data changed or additional model data became available later on, which did happen in testing) Point is, it is complex and definitely needs a lot of explanation. It may take a few days to write the page. It is very hard to explain. Data will not be available for Colin or 92L until those storms end due to errors in data processing early on along with another error that occurred. (that is why the entire system is in alpha testing)
After this I work on extending the wind and pressure data to 174 hours as well. Then on to some back end features to the system which should then wrap up most of the work on the system. Then it is on to lots of public alpha testing for the rest of the year. If it does well, then it gets the beta label. The old model system will run at least through this season. The old model system will probably be turned off for the off season, leaving the new system on, and then I might fully integrate the new system into our site so that it is then the only system. At that time the new system would continue in beta testing though it should be stabler at that point.
I really need to get back to working on my e-commerce site, so the NHC advisory data system will probably be something I work on for 2011 or 2012 despite the back end being written for years. I need to do the web interface, which would probably be easy at this point, but then there is always the NHC error cone which has haunted me for years. (I never have been able to get the code 100% correct to display it in Google Earth so that you could adjust the transparency. Solid color fine, but not transparent without it looking weird.)
July 31st, 2010... Work on the model error feature continues
I have been doing a lot of work on the model error feature in the last month. I am currently designing the web interface for it. After that, I'll continue with more testing. The feature is currently running on the live system for my own testing and it is not available to the public yet.
I updated a lot of the pages that contain links on this site to make sure they were still valid. I need to add a lot more links at some point, but right now my focus is on the new model system. I also updated the Google Earth overlay product.
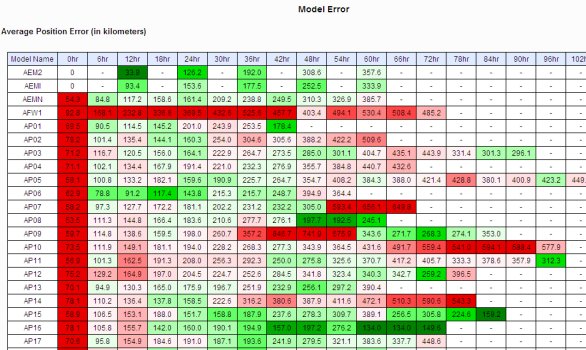
An example of the model error feature with the heat map feature turned on, which will compare the average error of all the models on the page and use color to indicate which are above and below the average error for each particular model.
I updated a lot of the pages that contain links on this site to make sure they were still valid. I need to add a lot more links at some point, but right now my focus is on the new model system. I also updated the Google Earth overlay product.
An example of the model error feature with the heat map feature turned on, which will compare the average error of all the models on the page and use color to indicate which are above and below the average error for each particular model.
July 23rd, 2010... A lot of work all over the place in the last 15 hours
From fixing the recon system on this site and the mirror to allow for the slight change to HDOB messages for missing data to coding the new model system to bypass the NOAA FTP server error that does not put out a renumbering file, it has been a long 15 hours of coding and testing and recoding and testing and a lot more where that came from. It would be nice if NOAA always had a renumbering file. (That is why NRL still has 97L as of this writing at 5:30AM if you were wondering). I'm too sleepy to go over everything. But at the moment, everything works. Except that past data for 98L and Bonnie are not available. That got lost in the massive amount of testing I did. I'll recreate the past data once the storms end. As for the model error system, that needs a lot of work still. I have a new plan. One that requires much more processing, but I'm just going to do that and be done with it. It has been too difficult to find other methods. One issue was the renumbering file not being there. I have fixed, oh I do hope I have, that error, but there is too much chance for the model error system to do something wrong unless I do the more processing method. I was trying to save the error up to a certain point to save processing then add to it for the current run. But the numerous ways that could go very wrong is too much. I just need to open all the error files and add up the error each time. (4 files a day, so if a storm was active 7 days, 28 files whereas if I did the way I wanted, I would have had one file with the latest model errors all added up and then added just the latest error. Would have saved processing, but too hard to do.) Now I'm off to bed. If something goes wrong email me. If something goes really wrong with the recon system, call me.
July 22nd, 2010... Our new real time NHC model error feature is being tested on the live system
It is not yet available to the public, but starting with 98L, the new feature is being tested internally on the live system. It needs a lot of testing and a lot of work still needs to be done. Here is an example of the feature when the model data was created for this year's TD 6E in our offline tests:
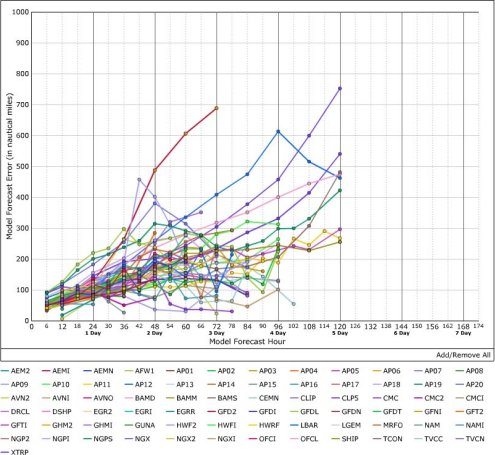
Please note that the above feature has yet to be well tested and may not contain an accurate error for that storm. The chart will act like our other diagrams. They will be interactive. This one is just an example to show the progress.
Please note that the above feature has yet to be well tested and may not contain an accurate error for that storm. The chart will act like our other diagrams. They will be interactive. This one is just an example to show the progress.
July 17th, 2010... Testing continues on the new model system
Testing is currently taking place on an offline setup due to the large amount of testing that is taking place. It is much easier to test the next round of features that way and also does not use a large amount of resources on our host's server. Current offline testing involves coding and then testing our new real time NHC model error feature. A lot of testing needs to take place on this feature before it is added to the live system. Even after it is, it may not be publicly available until a lot of real time testing takes place with live storms. A considerable amount of work still needs to be done on it.
The recon system has been updated to handle the latest change to HDOB messages. Missing data will now be coded as "///" rather than "999". This has not been well tested on our end yet, but the tests we did run were successful.
The recon system has been updated to handle the latest change to HDOB messages. Missing data will now be coded as "///" rather than "999". This has not been well tested on our end yet, but the tests we did run were successful.
July 8th, 2010... Testing continues
While I have not updated this page in awhile, testing has continued non stop. Countless updates have been made to the system and many more updates still need to be done. For the next week or two there will likely not be any really visible changes to the new model system since I will perform a lot of tests offline on new features that are easier to test on an offline server. The system will remain in alpha testing for months to come before it will become stable enough to be in beta testing. There are a lot of things I still need to do.
June 16th, 2010... Testing continues and the web interface is being constructed
I have not worked on any of the updates I want to make to the back end of the system yet. I am still just testing it and developing the web interface. As I need more data in the web interface, I need to make adjustments to some of the output to the system, such as adding additional files it creates or changing the file structure. I do anticipate more of both. A preview of the web interface can be found here. It will take some time to get the archive built and running along with the Google Maps and Flash diagrams. While Pacific data is currently on that page, it may not stay there. There will be an active model page on the East Pacific and Central Pacific sites, but until I construct the Atlantic one, it probably will not be available on those two sites.
The system got its first rename file test today for 93E/02E. It almost went perfect. I needed to make one adjustment as 93E did not go away as it was supposed to. I know exactly what happened and minutes after I was able to code the fix and it then operated as it should.
The system got its first rename file test today for 93E/02E. It almost went perfect. I needed to make one adjustment as 93E did not go away as it was supposed to. I know exactly what happened and minutes after I was able to code the fix and it then operated as it should.
June 15th, 2010... Testing continues on the new model system
Lots of testing has occurred over the past two days. There have been countless errors in the system, but as they popup I have fixed them. The errors have been easy to fix so far. Right now the system is operating for three storms, an invest in the Atlantic and two invests in the East Pacific.
The system needs more testing. The biggest test being what happens when a storm is upgraded from an invest to a depression or higher. That will be the big test. In addition, if a storm ever switches basins, I need to think about what should happen. The system is currently designed to move all the data to the storm it ends up being. I'm not sure I want to do it that way.
I am working on the web interface now before I get back to improvements to the Google Earth part of the system. I need to make sure I have all the data saved that I will need to generate storm pages. When the web interface is a little more complete, I'll release it here.
June 14th, 2010... The back end of the new model system is now live
In order to begin testing of the system, the back end of the new model system has been turned on. It check for new data at :02 and :32 past every hour. New features will be added, but since testing will be done offline for those features and then added in there was no time like the present to go ahead and turn it on. The system was turned on yesterday and has been operating for the North Atlantic, Eastern North Pacific, and Central North Pacific basins. You can access the new system below:
tropicalatlantic.com/models/google_earth/Models_for_the_North_Atlantic_Basin.kmz
tropicaleastpacific.com/models/google_earth/Models_for_the_Eastern_North_Pacific_Basin.kmz
tropicalcentralpacific.com/models/google_earth/Models_for_the_Central_North_Pacific_Basin.kmz
The new system is in early alpha testing. There will be bugs, so the old model system will continue to run and serve as the primary system on our site for now. If you notice any issues or have suggestions, let me know.
I'll be adding a legend for the wind swaths, looking into a better display of the wind swaths, improving the wind and pressure diagrams, working on the web interface, and looking into adding model error rates. I also need to work on seeing what data I will need for the web interface and creating a file that has what I need to create storm pages.
As of now, there is no web interface to this system. However, that will change in the coming days or week. The new system archives all of the data so you can get the previous model run you want to look at. The system is currently archiving data. For now you can manually get the data you want like this (not a real example below):
tropicalatlantic.com/models/archive/al/2010/92/0612/nhc/atcf/2010061412/2010061412.kmz
Changing it to get what data you want. Since invests repeat, the start date of invests is included in the link. "0612" above is June 12, the start date. For depressions and higher, it would look something like this (not a real example below):
tropicalatlantic.com/models/archive/al/2010/01/nhc/atcf/2010061412/2010061412.kmz
For invests that develop, all data, in theory assuming the system works correctly, will move all the data to the new folder for the developed storm. And if a storm ever switches basins, the system is designed to handle that as well, but until it occurs I'll be unsure if the system will do it properly.
June 13th, 2010... Update 2
The back end of the new model system just had its first successful live online test for 92L. I'll be testing some more combinations of tests tonight and adding more features. If the testing goes well, I might start running the system just after models are expected, to save server load.
June 13th, 2010 - Update 1... The back end of the new model system has been completed and online testing has begun
A whole bunch of progress has been made on many aspects of the new model system. Live public alpha testing could start at any time. Check back.
Last night I added the new experimental model plots using Google Maps Version 3 to the current model system. Look for "View our experimental Google Maps page." just above the Google Map when a storm is active. If you notice any problems or have any suggestions, let me know. I will likely improve the layout of the options somehow and will also probably have a way to display the model map full screen when the new model system gets going in the next few months. Right now I have a temporary solution to have a bigger view of it.
Internal online testing began today on the Google Earth part of the ATCF database system that displays the NHC model data, past best storm track, model wind swaths, and wind speed and pressure diagrams (though the diagrams do not display if there is a lot of data). Things are fluid at the moment and I have no idea when I might release it for testing. I am doing testing with it for the current active system. I am making a lot of changes to a lot of different things. I am still deciding for example what the folder structure will look like on my site for the new system. Since I do have at least one other system that will eventually be added, displaying advisory data from the NHC in Google Earth though without the error cone for now, I need to decide where everything will go. That advisory system (again without the error cone which I have spent hundreds of hours over the last four years trying to figure out), along with a UKMET system to display the model line, have been finished for years. I just never built a web interface for it. Once I decide on where stuff will go, I might release the system for alpha testing. There are still things to be added. I do plan on having model error data, but since the new model system is extremely easy to test offline now, I can release updates to the new system so that it remains operating. The way the new system is setup, I don't have to change anything in the main system file in order to test it on an online server and switch to and from am offline server. All the main configurations are in a separate file so that the paths to everything do not have to be in the main script. (Meaning a config file for the offline server and one for the online server and that's it!) I probably will set it to run just a few times after models come out and not all the time since I don't want to stress the server too much.
While I have not built any of the web interface for the new system, it would not be difficult to create one. It took me less than a half hour to add the Google Maps test onto the current model system. And, I have the recon archive system as a guide.
If you have any ideas on the Google Maps or Earth system, let me know. I have already received some feedback that is being incorporated into the new systems. Contact me here! Someone suggested adding a legend for swaths and I am going to do that. Also, I will try to see what solid color swaths looks like. I will do it for best track swaths, current and past, if it looks good, but I'm not sure about model wind swaths yet.
And here is something that might interest some, the new model system will run for the East Pacific and Central Pacific at the same frequency as our Atlantic system. This does not apply to our recon system or the future NHC advisory system, though the advisory system might run for strong storms. And the recon system we do turn on at times for the Pacific, but the complexity of that system will take awhile too convert so that it can easily operate in the Pacific. And, the recon system would increase the load on the server while the new model system will actually reduce the load operating for the additional basins due to the way it is written. Tropical Atlantic has finally sorted out how to display Pacific data when it's name is Tropical ATLANTIC. Buy more sites! Rather than move Tropical Atlantic to Tropical Globe, we instead acquired two additional domains, Tropical East Pacific and Tropical Central Pacific. And the interesting news is, when the new model system goes live for testing, these basins will start having model data on our other sites. The single new model system that operates at Tropical Atlantic distributes the data to the other sites since the sites reside on the same server.
And now I'll get back to coding and testing.
June 10th, 2010
Work is is continuing with the new model system. I have made a lot of progress on it. Here (example no longer available) is a prototype for the Google Maps model plots for the new system. It is written for version 3 of Google Maps. Here (example no longer available) is the latest test of the Google Earth file. (open in Google Earth) Take a look at the swaths that are now separate as a network link and the new pressure diagram.
June 6th, 2010
Work is ongoing with the new model system.
May 29th, 2010 - Update 2
I have begun special model runs on Tropical Globe for the system in the Pacific. Other than an initial error that had everything labeled with an "L" rather than "E" to represent the East Pacific, it is working well.
The model swaths will be out of the main file in the updated model system. (The best track swaths for the current position and past track will be in.) It just makes the file size too big and could really impact bandwidth. And, very few people would use it. There will likely be a network link in the main file to call the big file of swaths in the archive, if there is any, for that run. It actually makes things easier for the system. The nice thing about this system is that it will be designed to be much less demanding than the current one is on the server. That is because the current system downloads the model data every time it checks for the data and then processes it, even if nothing has changed. I never could get the coding in the current system to work so that it would only check if needed. The newer version of the model system will check to see if new model data or a new track update is available and only proceed with downloading the large model file and track file if needed. And it will be intelligent enough to redo Google Earth files by loading text files for data that has not changed. For example, if only the track of the storm has been updated, the track file will be downloaded and processed. The model data will be already processed from the last time the system downloaded and processed the data. It will be read from a text file and added into a new Google Earth file that is created that will be loaded into the Google Earth network link you refresh. However, it doesn't stop there. (And here is the part I am still working on.) Then I need to print a file for the archive. Here is where things get tricky. (And while I have the logic down on how I will do it, I am currently in the process of implementing this part.) All model data and past storm data will be archive. But, it will be archived by time. That means that I can't simply copy the Google Earth file I just created in the example I just discussed because the track data is 6 hours newer than the early cycle model data (and the late cycle model data that would have been available when the early cycle model data came out). I need to, in this example in the archive, add the new track data to a new Google Earth file that will not contain any model data. This will be the archive file. When new model data comes out, if it does, then I will download and process the new models available that are valid at the run time for that location update. It's confusing, but it will make sense when I complete the system. Think about a year from now if you were to look for a storm in the archive. You would want the track up to that point and the model data for that run time to be in the same file, not from different times. There are some complexities involved that I also need to code for.
The NHC advisory system, if I release that as well for testing this season, will be separate from the model/best track system. That is because I don't want any confusion of things like the NHC advisory track and best track or best track intensity and an intermediate advisory that might upgrade the intensity significantly. If the NHC advisory system is released later this season for testing, that system will be more visible than the model/best track system. I have not worked out how it will all work yet. The biggest things to do is building the system that displays everything. But, it should not be that difficult. The most difficult part will be simply deciding how best to display the data. (Aside from the NHC error cone if I decide to tackle that again.)
May 28th, 2010 - Update 1
Work continues on the new model system. While the system is more complex than I remembered, I am hopeful that something could be active for testing during this season since many parts of the system work and many parts are similar to work I have already done on other systems.
Here (example no longer available) is a more robust example of the features of the model system in progress. Because there are so many early cycle models trying to load, the early cycle intensity diagram does not work. And for those looking for a technically correct version of this file for Katrina at the time it happened, it is not completely accurate as it would have been then. The best track data used in this example file was redone at some point in perhaps post season analysis because the best track data differs slightly from what the CARQ position is. The new model system will not readjust for post season analysis as each archive of each model run and storm track to that point is important as that was what was known at the time.
I might not have wind swaths directly loaded into file. They are huge. I might load that separate to save bandwidth. That is likely I think. It is possible I might separate the spaghetti data as well, but I might go ahead and leave it since all of that is not as considerable as what the wind swaths can be.
May 26th, 2010... Your feedback is requested on the model system we are currently working on that is not yet available
I am currently working on the three to four year old, yet never released, updated model system. Since I am determined to actually get it finished in the next few months, I thought I would once again release a non updating example of what it looks like. Once again, it doesn't update, just a static example. (Although based on comments and my progress, I might add a different version from time to time.) You can view an example of it here. (Example no longer available) It is still a work in progress. (I know it says "Add time of last valid data" at the top, but since the data will eventually be called by a Google Earth network link, I'm not sure what the top of the directory tree will look like yet.) If you have any comments, let me know. Take a look at the new features like the intensity diagrams, wind swaths, past track, and the ability to display 5 days worth of model data or all of it. These will be the main new Google Earth features of the new model system. That part of the system is nearly built as you can see. (but needs a lot of real world testing) But I do not have the Google Maps models in the system yet. That system will likely not contain the ability to view 5 days worth of model plots or all. I will simply display all of them. (Though I do have an idea on how I might do it simply. I just don't want to write two separate pages but I might be able to do it with one.) My simply idea worked and it will have the ability to display either the complete plots or 5 days worth of plots. Took a few lines of code. In fact it was so easy, I might try to even make it so that you can choose how many hours of data you want to display in Google Maps. The intensity diagrams will eventually be on a separate page, in addition to sometimes being in the Google Earth file. When there are a lot of models, Google Earth will not display the flash intensity diagram within Google Earth with the way I have it currently setup. The part of the new model system I have yet to work on is the archive. The new system will eventually archive all old model data. It will likely look a lot like our recon archive. In addition to the new model system, I will also work on a new system which displays advisory data, though when that system will be ready I do not know. That system is also nearly complete, at least the Google Earth part. (Although as previously stated through the years, I never have figured out the NHC's error cone so that it looked perfect when partially transparent. I can make it a single color, but making it so it looks right when transparent, which is generally how you would want to look at it, I never have figured it out. It is always just a tad bit off in some circumstances.) I need to build an archive system for the advisory data system as well. I might just release some different versions of the NHC error cone too, ones that work but that just can't be made transparent. I still don't know how these systems will interact. I think the model system and advisory system will be completely separate to reduce confusion. But, I am also working on a way to integrate everything into once place. (including the recon system) An early mock up of that is here (example no longer available) and you can also let me know what you think on it as well. (Note how I was working on this updated system way back in 2006.) I would likely also make one Google Earth file that contained the recon system, model system, advisory system, and overlays, but all it would do is combine the network links into one Google Earth file. It would be a little crowded to make that the main product, but nice to show off all our Google Earth products in one place.
You can contact me here with comments.
Lastly, as for the Pacific data on the mock up page, the model system will be designed, though not well tested, so that it could be turned on for the East and Central Pacific basins. (The new system is being designed so that people who run our system on their own server for commercial use can easily run it and customize it.) It doesn't mean that our site will provide Pacific data on a routine basis. Additionally, advisory data and recon data will likely not be part of any new system. Although we currently provide recon data occasionally for the Pacific when people request it for active storms, I have not yet customized the Atlantic recon system so that I could easily have Pacific recon data all combined into one system. (As you can see from the look of that page, it is not well designed over there.) In the future, long in the future, I might move everything over to tropicalglobe.com and then provide Atlantic and Pacific data, but since it would put double the load on my host, I'm not sure I could get away with doing it. But I am a long way from being able to do it.
May 23rd, 2010
The model system is now operating at in-season frequency for 90L and will continue to operate at that frequency until the end of hurricane season. Meaning, our site checks every half hour (:00 and :30) for new model data. It also updates at 0:45Z, 6:45Z, 12:45Z, and 18:45Z to try and catch recently posted model data up to 15 minutes sooner than it normally would. (During off-season mode, our site was only checking every hour (:00) for new model data.)
May 22nd, 2010
It's almost time to begin another season. So far this year I have been working on another project, an e-commerce site I plan on launching later this year. That for profit venture should permanently fund this non profit site. However, since I have been making some money doing something other than that as well, I now have enough in reserve to work on this site some more again. And while I promise nothing, since I have been dragging my feet around on it for three years, I am finally revisiting the updated model system. I hope to have something working and available for public testing during this season. I am only starting today again on the project and revisiting old code, so it will take some time to get used to what I was doing previously and to see how far I have yet to go on it. It will not include the NHC's error cone. (I still have nightmares trying to get that thing to form correctly in Google Earth, lol.) It will likely not include NHC advisory data to begin with, even though that system was fairly complete. (aside from the NHC error cone) The new system is designed so that new things could be added later.
I just don't like the fact that I don't have past model archives. It would be helpful to see where the models have shifted. (Trust me, I've heard your feedback on that one.) And, I would like to offer 5 day plots in addition to the sometimes two week long plots which can sometimes confuse things. And, I want the intensity chart I have had completed for a few years to finally go live. Since there is still no really good sites online to display the data how the new system does it, it's about time I finally got it done.
So in review, I promise nothing, but hopefully I'll finally get the new model system up and running this year. The new model system will run parallel to the current one when ready. It will not impact the old one. Eventually, the old system will be discontinued and the new system, in a new location, would then take over. (The old system would let you know where the new one is.) That is unlikely to occur before the season ends because there will need to be a lot of testing.