Countries on this page are mostly organized by region according to how the United Nations defines geographic regions on the page here. (click the "Geographic Regions" tab on that page) This groups some countries that many consider to be in Europe into western Asia instead.
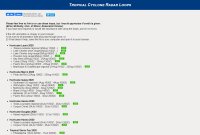
Tropical Globe's Database of Publicly Accessible Weather Radars
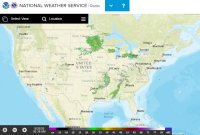
Our weather radar database map has been moved to its own page. You can click the image below to view it. Because the map uses a lot of memory, we decided to move the map to a new page.
Does the 3D option on our map not work? You may need to enable hardware acceleration or unblock your graphics card. Click here to learn more about how to adjust your browser's settings.
Our radar database contains over 1,600 radar sites from over 125 countries and territories. You can click a point on the map to access more information for a radar site, such as for a link that may contain data. For a complete listing of our radars, visit the page here.
Many of the radars in our database are from the WMO Radar Database. You can click the "About" link in the options panel on our map for more information.
Example of NOAA's enhanced RIDGE II display.
This is NOAA's RIDGE2 radar display. RIDGE stands for "Radar Integrated Display with Geospatial Elements". In December 2020, they updated their radar display to version 2, which was designed to be mobile friendly. This new display is much more complex to use than their previous display, though it does contain a significant amount of additional products, including more imagery types. In addition to Next Generation Weather Radar (NEXRAD; Wikipedia article) data, you can also view imagery from Terminal Doppler Weather Radar (TDWR; Wikipedia article) sites. The display can be a bit confusing to use.
To use the enhanced display, you may find the videos on their FAQ page here to be helpful, especially the "Full tour" here. Additionally, a NWS Webinar on the new display can be found in the YouTube video here. Their radar FAQ page also has information about where to find WMS layers that you can use to add the radar imagery to your own site or application. It also shows you how you can download a KML file of radar imagery for a particular radar site that can be opened in a program like Google Earth.
In the enhanced display, you can choose between "Local radar" and "National radar". That option is available by clicking the square icon, which has two squares in it, which is to the left of the magnifying glass icon.
If you select "Local radar", you can then choose what local radar you want to view data from by clicking a dot on the map. If available, it will be blue. If not, then in red. A circle represents a NEXRAD radar site and a square rotated 45° is a TDWR radar site. You can then access products specific to that radar site. Next to the four character identifier for that radar site will be the product that is currently selected. By default, it is "BREF.RAW", which is "Super Resolution Base Reflectivity". Click that to view a list of available products. You can see various products, including "Super Resolution Base Velocity", "One Hour Precipitation Accumulation" and "Storm Total Precipitation", among others. A legend appear across the bottom of the map for each product, such as the amount of precipitation, in inches, if viewing a precipitation product.
If you select "National radar", you also have various products to choose from. The default is "BREF.QCD", which is "QCd Base Reflectivity". ("with ground clutter / non-precipitation echoes removed") You can learn more about what these products are on their Frequently Asked Questions page here.
You can view severe weather watches and warnings on the map too. When loading the enhanced display from the link above, simply click the map where you want to zoom in to. If there are any issued watches and/or warnings for that region of the map, they will be displayed. If you click a point on the map, it will tell you in the top left corner whether there are any alerts (such as watches and warnings) for that specific location you clicked. If there are, it will tell you how many alerts there are for that specific location. Click on that text. A panel will then open showing you the alerts. Click on an individual alert to see a little more information. You will then be able to click "Details" to see the full text for that alert in a new window. Since this process it a bit complex, to access text information for an alert for a specific location you may find it easier to enter your location on the front page of weather.gov and viewing the text of active alerts that way.
If you are just interested in radar data, you can hide alerts. You can also set the transparency of the layers on the map. To access those options, click the vertical column of 3 dots to the right of the alerts message. You can then use a slider to adjust the transparency of various layers. Click the name of the layer to view any additional options there might be. For the "Hazards" layer, you can choose to view "All Hazards" or "Storm Based Warnings". If there are a lot of watches for a region, it might be easier to select "Storm Based Warnings" to display only those types of warnings, such as for thunderstorm and tornado warnings. It should be noted that when viewing "Storm Based Warnings" you will not see tropical cyclone warnings. You must select "All Hazards" to view those. You can set the transparency for the radar layer you are viewing. If viewing the "National radar", you can also set the transparency for the "Local Stations" layer, which are the dots and squares on the map that you can click. For that layer you can also choose which stations you want to view on the map, with options to view "All Types", "WSR-88D" (Weather Surveillance Radar - 1988 Doppler; a NEXRAD radar site) or "TDWR" sites".
Whenever you may a change to the display, whether by moving the map, selecting a layer or even choosing the transparency for a layer, the link will automatically update in your address bar. You should note that if you save a link with a layer made invisible, that preference will be saved in the link. That means if you hide the radar or hazards layer, and then save the link, it will not be visible when using that link. That might be confusing if you forget that data is hidden when visiting that link again. If you have selected to view "Storm Based Warnings", and you load that link where you saved that preference, you will not see any other alerts when you load the display. This could also be confusing as all other alerts, such as watches and statements in effect, will not be visible. A "No Alerts" message will appear, though if you clicked that it would then tell you "There are no storm based alerts in the visible area of the map."
The long links their site creates can't be deciphered. This makes it impossible for us to manually change in the link itself what a map points to since there are no visible coordinates in the link to change. That means that if we wanted to link to their display with specific settings on our radar database map, and zoom in to that specific region, we can't do that for each individual radar site unless we generated a long link for each radar site. (we can't simply add coordinates, or a zoom level, to the link to tell the map where to be centered at, or how far to zoom in) But this is not a problem for others as you can create whatever link you want. (We just don't want to create a unique one, for every radar site, every time they make some kind of change)
If you would like to view a link that allows you to choose which NEXRAD radar site you want to select, click here. If you would like a link to view the available TDWR sites, click here.
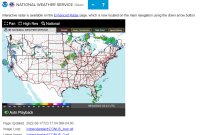
Example of NOAA's standard RIDGE II display.
They also have a standard display for low-bandwidth users. The imagery used in that display used to be in a "lite" folder. It is now in the folder here. This display also includes "Tornado", "Severe Thunderstorm", "Flash Flood" and "Special Marine" warnings on each image, if there are any active. A legend appears on each image. You can view the last 10 images in this display. It should be noted that when the new RIDGE was launched, imagery here did not update as quickly. However, the imagery does now appear to be update much better. This standard display didn't exist at the time. It was launched in September 2022. A PDF file here says that NOAA transitioned "the directory and display pages to a more supported server infrastructure". The imagery is now featured on the main enhanced radar display, forecast pages and on forecast office pages, so it does seem to work much better. However, to view current watches and warnings, it would be better to lookup your location on weather.gov to determine what alerts are current for your region rather than to wait to see what appear on radar. Before NOAA launched this standard display, we created one that used their imagery. You can still view it here.
For the latest status about which NWS radars are operating, you can click here.
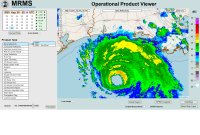
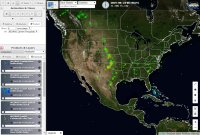
MRMS display on August 27th, 2020, when Hurricane Laura made landfall in Louisiana.
This display has a variety of product types you can display on an interactive map. It has a lot of advanced features. You can learn about the MRMS project here and here (where you can find an experimental version of the display as well). For an in-depth look at some of the features in the display you can review the product guide here. It's very detailed in its explanations of various features in the display. For each product page you have tabs you can click. ("Overview", "Strengths & Limitations" and "Applications & Examples") The "Applications & Examples" tab contains example images that are helpful. Many of the products in this display are very advanced, mostly for meteorologists, but you can find some of the basic radar features at the top of the product list.
You can also view older radar data in the display. When we tried it in October 2022, we could view data since October 2020. This display also includes most radars from Canada.
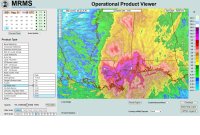
72 hour radar precipitation totals (using "Q3 Radar Only") during Hurricane Ida in 2021 near where the storm made landfall in Louisiana (period ending on August 31st, 2021 at 18Z; QPE scale of 24 inches; 60% opacity)
This display also has the ability to view precipitation totals over a specific time period, from 15 minutes to 72 hours. You can select either the "Q3 Radar Only" (about) or "Q3 Multi-Sensor" (about) option. A really nice feature is the ability to choose the rain rate scale you want, from 3 inches to 90 inches. If you click on the checkbox next to "Product Readout", you can then hover over the map to see the radar estimate for that location.
Velocity data can be found under the "Rotation" product type, which may also be called "Azimuthal Shear" in the display. You can read about it here in the product guide. It works differently than the velocity data you may be used to viewing for a single-radar site. You can also view an interactive MRMS Velocity-Based Products Course for information about how it works. There are other online courses on the MRMS display here. A PDF file here also has information about how the velocity product is created in the multi-radar display.
Example of their display
This interactive display has a lot of info. It has radar data from the last hour. You can also load a layer that will allow you to view hazards and warnings, such as for thunderstorms, tornadoes and many other hazards. Additional features include viewing surface observations where you can hover your mouse over a location and view weather information. National graphical forecasts are also available, such as for temperature and wind.
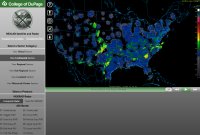
Example of College of DuPage's NEXRAD Composite Radar page
This site is a little challenging to navigate, but has some great radar data, including the ability to view loops of up to 200 images for various regions as well as for individual radar sites. For individual radar sites, click here for Dual-Pol NEXRAD data. You can view the instructions below on how to navigate the site.
The first link above contains composite radar imagery. To view localized imagery for specific regions, in the left column under "Select a Sector Category" click either "View Regional Sectors", "View Sub-Regional Sectors" or "View Localized Sectors", ordered from most zoomed out to most zoomed in.
The second link above allows you to view Dual-Pol NEXRAD data for individual radar sites. The range on these images is 124 nautical miles. You will then need to select the radar site you want to view by clicking "Radar Site Map" in the top right corner and clicking the site you want on the map that appears. When viewing the radar site you want to look at, click "Product Menu" in the top left corner for additional radar options, including changing the angle of the radar and velocity data. You can also hover your mouse over the left side of the page to view that menu. Around the top left corner of the radar image you can hover your mouse to view the number of images you would like to animate, up to 200 frames. Doing the same over the right side of the image will give you a menu of options, including to choose how often the display automatically updates. You can also download a zip file, or animated GIF, of the radar images.
Example of Weather Underground's WunderMap page
Weather Underground's WunderMap allows you to view radar data combined with weather stations, satellite data and a wide variety of other features. You can choose what you want on the map. You can zoom in as close as your house or as far away as you want. It also has radar data for Canada, Australia and for some of Europe.
Example of a NEXRAD radar layer in RealEarth™
In addition to an incredible amount of satellite imagery available, they also have radar layers available in their interactive map. Some of those layers are included in the link above in the left column. The imagery can also be looped in their viewer. You can select the time steps in your loop, such as an image every hour or every 6 hours, as well as set how many images you want to view in the loop. You can also control the speed of the loop. While the amount of archived data available varies, you can often go back several days for some of the radar options. You can also view the data in Google Earth. When you click the "Share" button you can save a link with the options you have selected as well as find a link in the window that pops up about saving a KML file in Google Earth.
In the link we set a product for which time is based upon. If that product in the link is not recent, you may not be able to view data until you select a time period. You have two options. In the "Product" tab, select the product you want to view and then for "Ending" select "Last". Then click "Apply changes" when the button appears. Or, you could instead go to the "Absolute" tab. Select the times you want and then click "Apply changes".
After you view a certain amount of imagery per day in the RealEarth™ display, a watermark will appear on the imagery. You can double the amount of imagery you can view per day if you register on their site for free. Beyond that, you will need to pay if you want to remove the watermark. You can learn more here.
For some tropical cyclones, including from around the world, his site has real-time radar loops if a storm is near a radar site. The loops are also archived. There is radar data for over 150 storms.
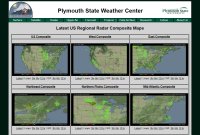
Example of U.S. Regional Radar Composite Maps page
The link above is for their regional radar composite maps of regions in the United States. For that imagery, you can select a 3, 6 or 12 hour loop. You can view a loop you can control or a GIF image. All of the products below allow you to view either an interactive loop or create a GIF image.
This page allows you to select an individual radar site on a map. That will take you to a page that will allow you to select from a large number of products, including long range and velocity data, for that individual radar site. You can select a single image or view a two hour loop. The "2-Hour HAniS Loop" option will allow you to view a loop with a time slider. Rather than click a radar site on the map you can also use the bottom of the page to view archived data from about the past fifteen days.
Like the previous NEXRAD option, you can click a map to view a TDWR radar site or view an archive of data from about the past 15 days. You can choose from a number of products and view a two hour loop.
This page links to some of the previous pages, but also links to other pages in which you can view archived data since 2017. You can create a loop for each for 4, 12 or 24 hours. You can also choose whether you would like to show counties on the imagery. For the pure radar options, you can choose from such things as "Base Reflectivity", "1-Hour Precip" and "Storm Total Precip". For the radar/satellite composite, you can choose from "IR" (infrared), "VIS" (visible) or "WV" (water vapor) and the satellite you want data from. (GOES-East or GOES-West)
NEXRAD Radar Composite Images - You can enter the ID of a radar site in which to center the radar image at. There is also an option to enter coordinates to center it at. For that option, you must use decimal coordinates and it must be separated by a comma.
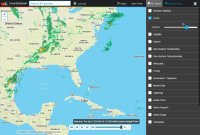
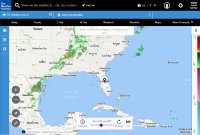
Example of Weather.com's Interactive Radar Map
Weather.com is owned by The Weather Company, which also owns the Weather Underground. This site has an interactive map with layers such as clouds, temperatures and winds. It also has data for the areas that the Wundermap radar has data available for.
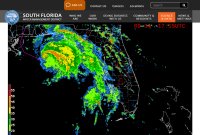
Example of "Florida Radar Loop" on September 14th, 2020 when Hurricane Sally was in the Gulf of Mexico
This site has long radar loops specifically for Florida. In the menu above the image on the front page, hover your mouse over "Current Weather Conditions". The "Florida Radar and Satellite Loop" page has a radar loop that combines radar and satellite imagery for the entire state. Regional loops are available for "West Central Florida", "East Central Florida", "South Florida" and the "Florida Keys". When there are advisories for a storm, the National Hurricane Center's track will be displayed in the imagery.
Other North American Radars
Aruba (Netherlands)
They have two pages with radar data from other countries. One contains data from Curaçao. (Netherlands) The other contains data from Venezuela, though that imagery has not updated since 2017.
Our site has a temporary mirror of this imagery here. Our display contains a longer loop than what the Bahamas radar display has. Our site automatically downloads their imagery on a regular basis and our display loads it from our site. If for some reason that display doesn't work, we have the same display here, but this one loads the imagery directly from their website instead. (So we don't use too much of their bandwidth, the length of the loop is less in that display.)
A composite loop of radars is available, with radars having a range of 250km.
When we checked their radar imagery in October 2022, we found data for three radar sites in their composite here. There are two other radars that seem to have also been built, for a total of five radars, but we don't know when data will be available for those two sites. (see our map for more information)
240km range loops are available. Canada's main radar display is on a dynamic map. We link to that above. You can also view imagery in their older radar display here. That section of their site is where individual imagery is available and where historical imagery for each radar site is.
Canada completed modernizing their radar network in 2023. You can find more about Canadian weather radars here. For outage and maintenance information on radars, click here.
450km range loop is available. You can view their meteorological service here. The X (formerly Twitter) profile for their meteorological service is here.
The radar was unavailable when we tested this radar site in June 2024. It didn't have data in multiple checks we did since September 2021, when it also didn't have data. When available, a 465km range image is available. This radar data is available on a new page. A loop was previously available, but we couldn't determine if one is still available when data is available. Data includes rain intensity (Intensidad de Lluvia). The 147km range imagery here has radial velocity (Velocidad Radial) imagery.
Honduras
250km and 500km range loops had been available here. The page no longer exists. You can view their main site here which now links to Nicaragua's radar on their front page. Their product page here links to radar data in the HTML of the page but the links don't appear because the images they show with the links don't appear. The images they try to show, and the images they try to link to, do not exist. Additionally, the links they link to had a security warning with a security program we use to check links. You can also visit the main page of the site the radar had been on by clicking here. An image loop from 2018 is available here for an example of what imagery had been available.
Jamaica
240km and 480km range loops are available at times. Make sure the time is current if imagery is available as this site in the past has had imagery that is outdated. In recent times, it might just be unavailable rather than showing outdated imagery.
When we tested this radar site in July 2024 it was not available. We do not draw the range on the map. A message on their site stated: "Information relating to RADAR images of Martinique is currently unavailable. Météo-France apologizes for the inconvenience and is doing everything possible to restore the service."
When available, a close-up image centered on Martinique is also available on this page.
Radar sites in Mexico are often unavailable. When available, 300km range loops are available for most locations, with some locations with a lower range, such as 240km. The availability of some of their radar sites sometimes changes. Some of the sites below may be available even when they are sometimes not included on Mexico's main radar page.
Another radar in Mexico City, a short range 60km radar, is available here from Sistema de Aguas de la Ciudad de México. (SACMEX)
For the state of Guanajuato, in the interior of Mexico, a composite radar loop is available here from the Secretaría de Seguridad Pública del Estado de Guanajuato, Protección Civil (Secretary of Public Security of the State of Guanajuato, Civil Protection) of their two radars. The city of Guanajuato is about 280km northwest of Mexico City.
For the states of Guanajuato and Querétaro, in the interior of Mexico, a 240km range loop is available here from the Comisión Estatal de Aguas (CEA) de Querétaro. (State Water Commission of Querétaro)
When we checked this radar site in June 2024 and October 2022, the radar wasn't working. You could view an image on the page here that said "Radar is currently down for repair & maintenance. Apologies for any inconvenience." The main link for the radar gives an "Access denied" message. When working, 150km, 250km and 400km range loops are available. The first two ranges have other radar products available too. See our map for more information, including an X-band radar that does not yet seem to have data online.
Argentina is expanding its radar network. Most of the radars in the National Weather Radar System (Sistema Nacional de Radares Meteorológicos, SiNaRaMe) are owned by the Secretariat of Infrastructure and Water Policy (Secretaría de Infraestructura y Política Hídrica), part of the Ministry of Public Works (Ministerio de Obras Públicas). They were installed by INVAP. You can learn more about their radar network here. In 2023 and 2024, they will be adding ten new radars that will also be installed by INVAP. You can learn more here (with a map of where the sites will be located), here and here. Additional information, including a few other radars that are not owned by them, is included on our map.
Brazil
Brazil's radars are on a variety of websites. Some radar sites appear on multiple websites. To view radar data for Brazil it's best to use our map. Our map organizes the links below for each individual radar site, as well as presents additional information.
Loops available. Araranguá (120km mobile radar that can be re-positioned; "SUL", for south, in display), Chapecó (240km; "OESTE", for west, in display) and Lontras (240km; "VALE", for valley, in display)
Barrancabermeja (250km), Carimagua (250km), Cerro Munchique (250km) and San José del Guaviare (300km). It also includes Aeronáutica Civil radar sites of Bogota (El Tablazo), San Andres Island (off Nicaragua) and Corozal (when data is available). The SIATA radar site for Medelin (Santa Elena) is also available. A composite loop of the radar sites is available here.
300km range loop for Bogota (El Tablazo) with id "GTA". San Andres Island and Corozal had been on this site, but are no longer listed. The main link also has a composite of Aeronáutica Civil radar sites in the country, though we don't know if that works like it used to since individual radar site data is no longer on the site for those two sites. Some radar ranges shown on the composite image may not have current radar data.
When we tested their site in July 2024 and October 2022, their site wouldn't load.
When available, various 60km range loops are available from their meteorological service. The radar sites, all in Quito, Ecuador, have a range of 60 kilometers. The radar page is difficult to navigate to from their site. Their main site is here.
250km range loop is available when working. When we checked this radar site in July 2024, imagery wasn't currently available. It didn't have data in multiple checks we did since March 2021, when it also didn't have data.
Peru
A radar for Piura at the Universidad de Piura (UDEP), with a range that might be 100km or 120km, seems like it will be here when available. The radar was unavailable when we tested this radar site in June 2024. It didn't have data in multiple checks we did since September 2020, when it also didn't have data. Their X (formerly Twitter) feed has an image from March 2020 here showing radar data.
View that radar site on our map for information about a mobile radar in Peru and about other radars that might be built.
When available, 250km and 450km range loops are available. A 250km range loop is available here, when imagery is available. You can view their meteorological service here.
Venezuela
Radar sites from Venezuela appear to no longer be available. You can view their meteorological service here.
300km range loop is available. Radar on the island of Terceira can be viewed at Portugal's meteorological service. On that page, for "Selecione RADAR", select "Terceira/SB". For "Selecione produto", select "Máximos Reflectividade (dBZ)".
Most, if not all, of their radars with publicly available imagery have a range of 300km. Each radar at their Hail Suppression Agency has an interactive map that you can loop. They also have a single 150km range image available for each radar site that is shown on the page linked above in a slideshow.
You can view their meteorological service here, and their weather site here, though those sites don't appear to have radar data as of updating radar data for this country. Data for radars owned by the Bulgarian Air Traffic Services Authority (BULATSA) might be online here, but you must request access.
A composite loop of their radars is available that covers the entire country. An interactive map is available here. These image links come from the page here. The range for each radar site seems to be 260km.
Composite loop of 240km range radars is available. The front page of their site has a map where you can add the radar layer. Click "Radar og lyn" (radar and lightning) to view the radar composite.
Their radar imagery is on a dynamic map that you can loop. Based on EUMETNET's OPERA Database, each of their radar sites seem to have a range of 256km.
In addition, NSA Souda Bay (Naval Support Activity, Souda Bay) is a navy base located on the island of Crete which has a radar. A 240km range loop is available here. 120km range loops are available for other products.
A composite loop of their 240km range radars is available on their main site. You can view additional radar data, including single site radar imagery, here.
Most of Italy's radars, around twenty, are on the Civil Protection Department (Dipartimento della Protezione Civile, DPC) website linked above. Some are on their own websites too. Some have their own website and are not on the composite linked above.
Radars that are on a different website and also on the DPC map:
Autonomous Provinces of Bolzano (South Tyrol) and Trento (Trentino)
Bolzano / Monte Macaion (120km loop). You can view a loop here from the province of Bolzano. You can view a loop here from the province of Trento. (Click "Radar" tab.) Another part of the province of Trento's site has it here. You can get data in Google Earth for this radar site here.
Civil Protection Department (Dipartimento della Protezione Civile, DPC)
Composite loop from Bologna / San Pietro Capofiume (125km) and Parma / Gattatico (125km) radars
Regione Piemonte and Regione Liguria
Savona / Monte Settepani (170km loop). You can view close-up radar imagery of the Ligurian region here by selecting options under "Regione Liguria". That is linked from Liguria's site and comes from here as well.
Concordia Sagittaria (250km loop) and Teolo / Monte Grande (250km loop). A shorter range loop is also available for each. An interactive radar composite of their radar sites can be found here. (which also includes Valeggio sul Mincio)
Imagery doesn't appear to be publicly available. Their old site's front page had a link that translated as "Joint radar map ANM and SHS". Those are the abbreviations of Moldova's and Romania's meteorological services and the link was to Romania's radar display here. I couldn't find evidence that Chișinău International Airport's radar, built in 2013, might be integrated into Romania's display.
The WMO Radar Database has nine MRL-5 radars listed for Moldova, though we don't know which, if any, of those radars might still be in use.
Their two radars, with loops available, are on their meteorological service's front page. One has a range of 150km and the other 200km, though their imagery doesn't show the entire range of either radar in some directions.
240km range loops are available. Their site no longer has a main radar page. You have to link to a particular location and view the radar map centered at that location. We link to the map for Oslo.
300km range loops are available. You can view their dynamic radar mosaic here, on a dynamic map. They also have radar sites for Madeira, on the island of Porto Santo, and the Azores, on the island of Terceira.
A composite loop of their radars is available. Their main radars have a range of 250km. When available, they also have a short range Belgrade radar here that is about 70km.
240km range loops are available. Their interactive map, which is linked above, contains a composite of their radars. To view single radar site imagery, click here to view their other display.
We could not find radar data online for their Shahura radar. You can visit their national weather service at the link above.
Ethiopia is building new radars. A Vaisala press release here indicated the Shahura radar was the first of four radars to be built. A PDF file here seems to indicate on PDF page 55 that the other locations might be Gore, Alaba Kulito and Enewari. The map there also indicates that another eight are proposed after that.
300km range loop is available. Radar on the island of Porto Santo can be viewed at Portugal's meteorological service. On that page, for "Selecione RADAR", select "Porto Santo/PE". For "Selecione produto", select "Máximos Reflectividade (dBZ)".
A radar image is not available in real time as of updating this page for this country, but it has been posted to their X feed (formerly Twitter) in the past.
Radar data from South Africa does not appear to be available freely to the general public in a way like other countries provide data. A radar storm tracker page exists, but it only draws, in red, the shape of where a current storm is. In orange is what appears to be where the storm is forecast to be in 30 minutes. In yellow is what appears to be where the storm is forecast to be in 60 minutes. (This seems to be explained on this page when talking about the weather API they have through their partner AfriGIS) They also have a satellite page here that has an image that has some data colored like rain, but it might just be colorized based on satellite IR data.
It appears that you need to be a "Valid Aviation User" in order to register for the site to view more detailed imagery. You can read more about that on their subscription page here. It says that "until a pay-portal is implemented access to the site will be limited to aviation users meeting the requirements above." In the charts on that page it says that radar imagery, either national or provincial, will not be free when the pay-portal is implemented. For now someone can access that data only if they are a "Valid Aviation User" which is defined as "Operating in or from South African Airspace" and seems to apply to people, such as pilots, and businesses related to aviation. Our map does not display the ranges of the radar sites from their meteorological service since the data is not the same as what is freely available from other countries. Their radar sites seem to each have "a range of about 200 km" based on the radar section of the weather API they have through their partner AfriGIS. In 2010 and earlier they did provide radar data similar to other countries. At that time, some radar sites had imagery that had a range of 300km.
Sometimes 200km range radar imagery is available from North-West University (NWU) on the Lekwena Wildlife Estate. It is often not available. Make sure to check the date if the imagery loads. "The NWU Lekwena radar is a test bed for students to learn and develop creative solutions related to weather forecasting and now-casting. This means that the Radar can be switched off for maintenance or it could be broken on purpose in the name of learning. The radar should not be used as a tool to make any severe weather alerts as the South-African Weather Service is the only credible institution to do this. The radar should only be viewed as a tool for the development of young scientists and something interesting to look at."
Asian Radars
Azerbaijan
Azerbaijan does not seem to provide radar data in real time. However, they do describe what they see on their two new Baron radars, sometimes throughout the day. You can view that for Göygöl and Shamakhi (Şamaxı). They also occasionally link to their YouTube channel which has animation of the radar sometimes. We have additional information on our map.
To view the imagery, when available, go to the bottom of the page where you will find a tab for "Radar Images". You can also view the imagery here. The range is about 190km when available. There is an option to animate the image, but we haven't been able to try it when the radar is working.
In addition to a national radar composite, as well as regional composites, single radar site loops are also available for the few hundred radars in their network. The ranges of their radars vary, from 125km to 460km.
When available, imagery might be available from one, or both, of the two radar sites. Make sure to check the date of the imagery. You can visit Cyprus' meteorological website here.
Georgia
While Georgia has multiple radars, I couldn't find current data from them online. Additional information on the radar sites for this country is on the map.
India has over two dozen radars. 250km range loops are available for many radars, with a shorter range loop also usually available. Most radars have a range of 500km that you can view imagery for in the image section, which is separate from the "animations" section where you can view loops. The image section contains additional imagery for the radars.
Indonesia continues to expand its radar network, with over 40 radar sites and counting. Most of the single image radar imagery available has a range between 200 and 250km.
When available, a 280km loop is available for Tel Aviv from the Israel Meteorological Service, which is linked above. (click "Radar" link on the page) When available, a 165km range loop is available here from Dalton from the company EMS Mekorot Projects.
The Japan Meteorological Agency has their radar data on a dynamic map. You can view that at the link above. The range of imagery we show on our map reflects the estimated range of imagery on their site.
The Ministry of Land, Infrastructure, Transport and Tourism (MLIT) has their own radar network of dozens of C-band and X-band radars. You can view their display here in Japanese and here in English. The Japanese display has more options, such as choosing between their X-band and C-band radars.
Jordan
Their radar doesn't appear to be publicly available in real-time yet. They do post radar imagery to their Facebook page occasionally. An example is here. In 2018, some people asked about getting the link and their response was, translated using Google Translate: "The radar belongs to the Meteorological Department and is now under test. The link to it cannot currently be published." There is a page here that translates as being titled "Air Radar". It has said it is "Under Construction" since 2016. It's uncertain if that is the page it might be added to. This newer radar was built in 2017. The English language version of their website is here, though as of checking their site they don't have that "Air Radar" page in that version of their site.
There are two radar composites available, each consisting of multiple radars. One composite is on the peninsula and one in the eastern part of Malaysia. The range from each radar site is 300km. Loops are not available.
Maldives
Radar imagery doesn't appear to be available in real time. You can view their meteorological service here. On occasion, they post radar imagery through social media, on Facebook and X (formerly Twitter). They have an app that references radar imagery in it but it has a message that says "Radar images not available".
The 180km range radar loop for Mongolia's capital, Ulaanbaatar, is on their front page. Near the bottom of the page, where you see a map, you must click the "РАДАР" ("radar") tab.
As of checking Nepal's site in June 2024 and October 2022, radar imagery on their site was last updated on August 24th, 2021 for their Birendranagar radar site. That older imagery did not include imagery from their other radar sites. We link to that above. Their radar network is new, with the three radars currently on our map seemingly built in 2019 or 2020. You can click here for their Department of Hydrology and Meteorology and here for their Meteorological Forecasting Division.
As of checking the radar sites for this country in September 2022, only Islamabad and Karachi, which have 450km range loops available, had imagery that was automatically updated. Some of Pakistan's radar sites have imagery that is manually updated. You can check our map for more information on the radar sites for this country. Other radar sites have ranges from 120km to 300km. Additional new radars are planned.
You can view their main site here. Their interactive map contains a composite of their radars. The ranges of their radars seem to vary. Because they no longer seem to have the ability to view imagery for a radar site individually, we're unsure of the range of available imagery for many of their radar sites.
When available, they have a 250km loop. When we tested the site they have for weather data in October 2022, February 2022 and January 2022, their site was not responding. Their main site, which loads the site that wasn't responding, is here.
While Saudi Arabia previously had single site radar imagery available, their imagery might only be in a composite now. When we tested their sites in October 2022, we could no longer load imagery on the pages here and here.
South Korea has data in a variety of different radar displays. The main site we link to has composite imagery having a range of at least 240km for individual radar sites. To get single site radar imagery, hover over "Radar Images" in the menu and then click "Individual Images". You can then click an "id" to get data for that particular radar site.
Individual imagery usually has a range of 240km unless we note otherwise. You can find the Korean version of the main site we link to here. For 480km range composite imagery, click here. The range we show on our map is usually 480km for their radar sites.
A composite loop that contains 460km range imagery from some of their radars is available. If you click the "Rain Radar" tab, they have several radar sites that have single radar site image loops with ranges of about 150km.
Thailand
Thailand's radars are on a variety of websites. Some radar sites appear on multiple websites.
Around two dozen radar sites. You can manually loop imagery using controls. A newer page links to some of the radar data on that site here. You can view some of the radar imagery here too. This page has information about their mobile radars which are not included on our map.
A 150km range loop for Nong Khaem (static, loop, dynamic) and a 120km range loop for Nong Chok (static, loop, high-res static). These also appear on the previous two sites.
The range of their radar imagery is between 200 and 300km for the imagery they have for individual radar sites. On their composite image, linked above, the range for a few radars is shown as being around 450km.
Australia is adding radars and upgrading older radars. You can learn more here about the new radars and here about project details, which also includes brief information on upgrades.
A dynamic map here is also available, though when we tried it you could not view a loop. (If you use an ad blocker, you may need to turn it off for map layers to show)

