There are currently no active tropical systems in the North Atlantic.
Saturday, July 19th, 2025 0:14 ZJul. 19, 2025 0:14Z
Model Data
For official information on current tropical storms and hurricanes in the North Atlantic and Eastern North Pacific basins, visit the National Hurricane Center. For other basins, visit the World Meteorological Organization's (WMO) site here for links to other official sources.
Some of the links on this page link to model data that meteorologists use to make forecasts. For official information, please consult official sources, such as an official agency responsible for forecasting tropical cyclones or the national weather service of your country for other weather information.
This page has individual sections for some of the global models that forecasters use. Within each section for a global model, we link to the main agency that provides that model data. There might be better sites to view that particular model on. Additional sites to view models on are either in the "Featured Model Sites" or "Other Model Sites" sections. Those sections contain model sites that contain multiple models. For sites in those sections, we list some of the models available on each particular site.
Some models are known by a variety of either informal names and/or abbreviations. This section covers some of the model names and abbreviations that you will see on this page and on some of the sites we link to.
National Oceanic and Atmospheric Administration (NOAA)
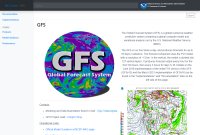
GFS - Global Forecast System
GEFS - Global Ensemble Forecast System, previously known as GFS Global Ensemble
HWRF - Hurricane Weather Research and Forecasting model
HMON - Hurricanes in a Multi-scale Ocean-coupled Non-hydrostatic Model (also: Hurricane Multi-scale Ocean-coupled Non-hydrostatic model)
NAM - North American Mesoscale
HRRR - High-Resolution Rapid Refresh
SREF - Short Range Ensemble Forecast
NAEFS - North American Ensemble Forecast System
HAFS - Hurricane Analysis And Forecast System
RAP - Rapid Refresh model
HREF - High Resolution Ensemble Forecast
HRW-FV3 - High-Resolution Window (HRW or HIRESW) - Finite-Volume Cubed-Sphere (FV3) model (HRW-FV3 or HiresW-FV3)
HRW-ARW - High Resolution Window (HRW or HIRESW) / Advanced Research Weather (ARW) Research and Forecast (WRF) model - This might be what some sites also have as WRF-ARW.
ECMWF - European Centre for Medium-Range Weather Forecasts
IFS - Integrated Forecasting System
HRES - High-resolution forecast
EPS - Ensemble Prediction System
CMC / Environment Canada
GEM - Global Environmental Multiscale
GDPS - Global Deterministic Prediction System
RDPS - Regional Deterministic Prediction System
HRDPS - High Resolution Deterministic Prediction System
GEPS - Global Ensemble Prediction System
REPS - Regional Ensemble Prediction System
UK Met Office (UKMET / UKMO)
UM - Unified Model
Global Atmospheric - Met Office Global Atmospheric Hi-Res Model - Deterministic
UKV - Met Office UK Atmospheric Hi-Res Model (UKV) - Deterministic
MOGREPS-G - Met Office Global and Regional Ensemble Prediction System - Global
MOGREPS-UK - Met Office Global and Regional Ensemble Prediction System - UK
Deutscher Wetterdienst (DWD) - German Meteorological Service
ICON - Icosahedral Nonhydrostatic model
U.S. Navy
NAVGEM - Navy Global Environmental Model
Japan Meteorological Agency
GSM - Global Spectral Model
Météo-France
ARPEGE - Action de Recherche Petite Échelle Grande Échelle model
For information on most of the models released in the National Hurricane Center's (NHC) Automated Tropical Cyclone Forecasting (ATCF) system, see the section here on this page.
Featured Model Sites
This section features model sites that contain multiple models and/or have features that make the data easier to view. For simplicity, these sites are not included in the sections we have for some of the global models.
* The "FV3 Hi-Res" is likely the "High-Resolution Window [HIRESW] - Finite-Volume Cubed-Sphere [FV3]" model (HRW-FV3 or HiresW-FV3) based on the HiresW-FV3 having a similar abbreviation and a model that is also available hourly through 60 hours.
* The "RGEM" is likely "Regional Deterministic Prediction System" (RDPS), a regional version of the Global Environmental Multiscale (GEM) model.
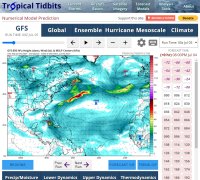
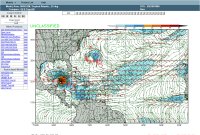
The model display on this site, and the scope of products you can look at for each model, make this one of the best sites for model data. The imagery is very detailed and the site also has excellent controls to loop model data. You can view model runs from the past week by selecting the drop down box that has the model run time.
To change the map you are looking at, click the "Regions" button. To select the product you want, click either "Precip/Moisture", "Lower Dynamics", "Upper Dynamics" or "Thermodynamics" to access a menu of products for each.
Global Forecast System (GFS) - NOAA - Global Model - Every 6 Hours
Example of GFS home page at NOAA/NWS' NCEP.
"The Global Forecast System (GFS) is a global numerical weather prediction system containing a global computer model and variational analysis run by the U.S. National Weather Service (NWS)."
"The GFS is run four times a day, and produces forecasts for up to 16 days in advance. The forecast component uses the FV3 model with a resolution of ~13 km. In the vertical, the model is divided into 127 vertical layers. It produces forecast output every hour for the first 120 hours, then every 3 hours for days 5-16."
You can learn more about the GFS at the National Centers for Environmental Prediction (NCEP) here (where the quotes above come from) or from the Wikipedia article here.
In addition to the GFS, there is also an ensemble system called the Global Ensemble Forecast System (GEFS), previously known as the GFS Global Ensemble. "The Global Ensemble Forecast System (GEFS) is a weather model created by the National Centers for Environmental Prediction (NCEP) that generates 21 separate forecasts (ensemble members) to address underlying uncertainties in the input data such limited coverage, instruments or observing systems biases, and the limitations of the model itself. GEFS quantifies these uncertainties by generating multiple forecasts, which in turn produce a range of potential outcomes based on differences or perturbations applied to the data after it has been incorporated into the model. Each forecast compensates for a different set of uncertainties." (quote from the page here) In September 2020, the ensemble system was expanded from 21 to 31 members. (see PDF file here)
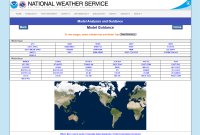
Model data for the GFS is available from this page at the National Centers for Environmental Prediction (NCEP), part of NOAA's National Weather Service (NWS). Other model data on this site includes the GEFS, NAM and other models, including some that are shorter range models. To access these models, click the "Model Guidance" tab on the main page.
This site also has HMON and HWRF (worldwide) data for active tropical cyclones. You can access it on the "Tropical Guidance" tab.
On the "Observations and Analyses" tab you can find Real-Time Mesoscale Analysis (RTMA), Upper Air Plots (UAIR) and Skew-T Plots (SKEWT).
This site takes some getting used to. We'll explain how the "Model Guidance" page works. To access data you must first click "GFS" under "Model Type". Next, you must click a "Model Area". As you move your mouse over each option, it will display what region you can view data for on the map. When you are ready to view data, click the region name. On the next page you will select the type of data you want to view. If you are on a device with a mouse, you can hover your mouse over each product to view a short description of what it is. If you can't do that, or need more information on what it is, click the product. Once you do you will see a "Product Info" button in the top right corner. It will give you more detailed information about what the product is. Once you have selected the product you want, a list of image frames to view, as well as looping options, appear on the page.
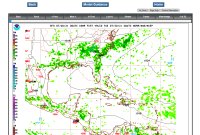
Example of Simulated Radar Reflectivity Image for the Western North Atlantic from Model Analyses and Guidance page at NOAA/NWS' NCEP
To actually access the data you want, you can either choose a single frame, which will take you to a page in which you can choose to go to the next or previous frame, or you can instead view a loop which you can animate. If you want to loop all 16 days worth of data, click the "Loop All" text. If you wanted to view a 7 day loop, you would instead choose the "7 Day" text. The looping option also allows you to advance to a the next or previous frame. You can slow or speed up the loop. You can click the "View Image" button if you want to view the actual image you are seeing. (which can then allow you to save it) If you left click on the image you are viewing in the display, it will zoom in on the image. If you right click, it will zoom back out. If on a touch device, you can touch the image to zoom in and use the "Un-Zoom" button to zoom out.
When navigating through their site, make sure to use their "Back" button rather than your browser's back button. That saves the options you had chose on the previous page you were at.
We have some direct links to some product types for various regions below.
Western North Atlantic (S.E. US, Central America, Carib):
European Model (Integrated Forecast System, IFS) - ECMWF - Global Model - Every 12 Hours
Example of ECMWF home page
The Integrated Forecasting System (IFS) is a global model developed at the European Centre for Medium-Range Weather Forecasts (ECMWF). It is also referred to by some as the ECMWF model or the European model.
"The comprehensive Earth-system model developed at ECMWF in co-operation with Météo-France forms the basis for all our data assimilation and forecasting activities. All the main applications required are available through one computer software system called the Integrated Forecasting System (IFS)." (quote from the page here)
In addition to a high-resolution forecast (HRES), an ensemble forecast (ENS) is also available. (ECMWF Ensemble Prediction System [EPS]) "The atmosphere is chaotic, meaning that even small differences in its state can lead to very different weather patterns occurring several days later - this is sometimes referred to as the butterfly effect. To account for the chaotic nature of the atmosphere and the associated uncertainty in prediction, we run an ensemble of 51 forecasts simultaneously; the forecast using the best possible initial state plus 50 other forecasts with slight variations to the initial state. Our ensembles provide a probabilistic forecast which is an estimate of how predictable a particular weather situation is." (quote from the page here)
You can learn more about the IFS from the Wikipedia article here.
This is the main model charts page at ECMWF. This page has a lot of charts to choose from. You can use the options in the left column on the page to filter the number of charts you can choose from.
Mean sea level pressure and wind speed at 850 hPa:
"These charts represent forecasts of Mean Sea Level Pressure (MSLP) and Wind speed at 850 hPa all from the ECMWF high resolution forecast (HRES)."
"Charts denote HRES output at the 700 hPa level, for regions in the tropics. The brown arrows are wind vectors (legend shows the scale in m/s). The coloured fields denote relative vorticity or divergence; the drop down 'parameter' menu above allows the user to select which one." We link to "Relative vorticity".
"These charts show forecasts of Mean Sea Level Pressure (MSLP, that is surface pressure reduced to mean sea level), and 6h or 12h precipitation from the ECMWF HRES model". "MSLP is shown with black contours (isobars every 5 hPa)."
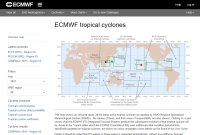
"Generated automatically whenever a tropical cyclone is observed (reported via the Global Telecommunication System) at the initial time of the forecast and is present in the high-resolution forecast and/or ensemble (ENS)". The map on the page "shows, as coloured spots, all the latest active tropical cyclones as reported by WMO Regional Specialized Meteorological Centres (RSMCs - the names of these, and their areas of responsibility, are also shown). Clicking on a spot shows what the ECMWF IFS (Integrated Forecast System) predicts the subsequent evolution of that tropical cyclone will be. Areas in the Tropics within which the ECMWF Ensemble (ENS) uses additional initial condition perturbations, specifically targetted on tropical cyclones, are shown as colour rectangles".
"These products are based on tropical cyclone activity throughout the forecast. They are produced twice a day from the ENS, twice a week for the extended range (month ahead) and once a month for the seasonal forecasts. They give an indication of the potential tropical cyclone activity in the coming days, weeks and months."
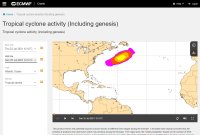
Tropical cyclone activity (including genesis):
Example of ECMWF's tropical cyclone activity (including genesis) page for tropical storms in the Atlantic.
"This product shows the potential tropical cyclone activity at different time ranges during the forecast. It includes both tropical cyclones that are present at analysis time and those which may develop during the forecast. The maps show the 'strike probability' based on the number of ENS members that predict a tropical cyclone, each member having equal weight. The strike probability is the probability that a tropical cyclone will pass within a 300 km radius from a given location and within a time window of 48 hours."
"Tropical storm weekly mean frequency and weekly mean Accumulated Cyclone Energy (ACE). The 'Tropical storms' have a relatively large range of wind speed (wind speed higher than 17m/s), so includes storms of hurricane strength. The ACE of a tropical storm is calculated by summing the square of the estimated maximum sustained velocity of every active tropical storm at six-hour intervals. The ACE of a time period is the sum of the ACEs for each storm and takes into account the number, strength, and duration of all the tropical storms in the period. The 51-member ensemble forecast is compared with the model climatology (11-member ensemble over the past 20 years)."
Tropical storm probabilities
"Probability in % that a tropical storm, a tropical depression or an hurricane will strike within 300 km for weekly periods. 'Tropical depressions' includes all tropical cyclones with wind speed higher than 8 m/s, while 'tropical storms' includes all TCs with a wind speed higher than 17 m/s and hurricanes are just those TCs with a wind speed higher than 32 m/s. Probabilities are computed from the 51 members of the real-time monthly forecasts." Conversions: 8 m/s (~15.5 kts), 17 m/s (~33.0 kts), 32 m/s (~62.2 kts)
Canadian Model (Global Environmental Multiscale, GEM) - CMC / Environment Canada - Global Model - Every 12 Hours
Modelling home page at Environment Canada
Environment Canada's Global Environmental Multiscale (GEM) model is Canada's global model system. The model is sometimes referred to as the CMC which stands for Canadian Meteorological Center. You may also see MSC for Meteorological Service of Canada.
"Analysing and forecasting the weather, using numerical models, requires an impressive amount of computing and data processing power. The process which leads to the production of a forecast can be seen as an endless cycle of data ingestion and analysis. Twice a day, the analysis serves as the starting point upon which atmospheric numerical models base their predictions." (quote from the page here)
There are a variety of model names and acronyms that you might see on various sites for their model systems depending on if it is their deterministic or ensemble system and whether or not it is global or regional.
For deterministic prediction:
Global Deterministic Prediction System (GDPS) - About
"The Global Deterministic Prediction System (GDPS) carries out physics calculations to arrive at deterministic predictions of atmospheric elements from the current day out to 10 days into the future. Atmospheric elements include temperature, precipitation, cloud cover, wind speed and direction, humidity and others. This product contains raw numerical results of these calculations. Geographical coverage is global. Data is available at horizontal resolutions of 25 km and 66 km. Data is available for 28 vertical levels. Predictions are performed twice a day." (quote from the page here)
Regional Deterministic Prediction System (RDPS) - About
"The Regional Deterministic Prediction System (RDPS) carries out physics calculations to arrive at deterministic predictions of atmospheric elements from the current day out to 48 hours into the future. Atmospheric elements include temperature, precipitation, cloud cover, wind speed and direction, humidity and others. This product contains raw numerical results of these calculations. Geographical coverage includes Canada and the United States. Data is available at horizontal resolutions of 10 km. Data is available for 80 vertical levels. Predictions are performed four times a day." (quote from the page here)
High Resolution Deterministic Prediction System (HRDPS) - About
"The High Resolution Deterministic Prediction System (HRDPS) carries out physics calculations to arrive at deterministic predictions of atmospheric elements from the current day out to 48 hours into the future. Atmospheric elements include temperature, precipitation, cloud cover, wind speed and direction, humidity and others. This product contains raw numerical results of these calculations. Geographical coverage of the system is most of Canada. Data is available over specific areas in the MSC Datamart and the whole coverage is available in the MSC GeoMet web services. Data is available at a horizontal resolution of 2.5 km. Data is available for 28 vertical levels. Predictions are performed up to four times a day." (quote from the page here)
"Global ensemble forecasts are made twice a day using the Canadian GEM model to generate potential weather scenarios up to 16 days. 20 'perturbed' weather forecasts are performed as well as an unperturbed 16-day control forecast. The 20 models have different physics parametrizations, data assimilation cycles and sets of perturbed observations." (quote from the page here)
Regional Ensemble Prediction System (REPS) - About
"The Regional Ensemble Prediction System (REPS) carries out physics calculations to arrive at probabilistic predictions of atmospheric elements from the current day out to 3 days into the future. The probabilistic predictions are based on 20 ensemble members that are perturbed through their initial and boundary conditions as well as physical tendencies. A control member that is not perturbed is also available. Atmospheric elements include temperature, precipitation, cloud cover, wind speed and direction, humidity and others. This product contains raw numerical results of these calculations. Geographical coverage includes Canada and the United States. Data is available at a horizontal resolution of 15 km. Data is available for 48 vertical levels. Predictions are performed twice a day." (quote from the page here)
You can learn more about the GEM model from the Wikipedia article here.
While the model does have global data, it is not available on Environment Canada's main model imagery pages. For global imagery on their site, they only have data for much of North America, as well as parts of the northern Atlantic and eastern North Pacific. To view global model imagery, you will need to view it on other model sites. For regional imagery, they have data for Canada and most of the United States.
United Kingdom Model (Unified Model, UM) - UK Met Office (UKMET / UKMO) - Global Model - Every 12 Hours for 6 Day Global Deterministic Forecast
Unified Model home page in the "Research programmes" area of Met Office's website
The global model for the United Kingdom is the Met Office's Unified Model (UM). The model might be abbreviated a variety of ways, including relating to the name of their country and meteorological service, such as UKMET or UKMO.
Note: While Met Office has short term forecast maps on their site here for the UK and weather forecasts for cities around the world, it doesn't seem to have easily viewable data from their Unified Model on their own website. As of updating this section in August 2021, you can access raw data from Amazon Web Services here or get 1GB of data every month for free of "Atmospheric model data" here. To view this model, view some of the other sites on our page that have data from the Unified Model.
"The Unified Model (UM) is a numerical model of the atmosphere used for both weather and climate applications." "Seamless modelling, whereby a single model family can be used for prediction across a range of timescales, has been at the heart of the Met Office strategy for weather and climate prediction since 1990. The Unified Model applies this seamless modelling approach, which means that the same dynamical core and, where possible, the same parameterization schemes are used across a broad range of spatial and temporal scales on a traceable frame work. The model is suitable for numerical weather prediction (NWP), seasonal forecasting and climate modelling with forecast times ranging from a few days to hundreds of years. Furthermore, the Unified Model can be used both as a global and a regional model." (quotes from the Unified Model home page in the "Research programmes" area of Met Office's website)
There are global and regional configurations of the Unified Model for deterministic and ensemble forecasts. Their "Numerical weather prediction models" page in the "Research programmes" area of their website contains information about each of the models. They also have additional information about what the models seem to be called on the UK Met Office page at Amazon Web Services which has information about how the raw model data can be downloaded. It also has a list of parameters for each model.
On this page we refer to the global deterministic model as "Unified Model / Global Atmospheric" (many sites may call it either UKMET or UKMO) and the UK version as "UK Atmospheric". For the ensemble, we use "MOGREPS-G" for global ensemble and "MOGREPS-UK" for UK ensemble.
For deterministic prediction:
Met Office Global Atmospheric Hi-Res Model - Deterministic
Met Office UK Atmospheric Hi-Res Model (UKV) - Deterministic
For ensemble prediction:
Met Office Global and Regional Ensemble Prediction System - Global (MOGREPS-G)
Met Office Global and Regional Ensemble Prediction System - UK (MOGREPS-UK)
You can learn more about the Unified Model from the Wikipedia article here.
Navy Global Environmental Model (NAVGEM) - U.S. Navy - Global Model - Every 12 Hours
U.S. Navy's Global & Regional Weather and Wave Prediction Charts home page
The Navy Global Environmental Model (NAVGEM) is run by the U.S. Navy's Fleet Numerical Meteorology and Oceanography Center (FNMOC).
This model replaced the NOGAPS (Navy Operational Global Atmospheric Prediction System) model in early 2013.
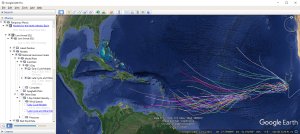
Example of Tropical Globe's Tropical Cyclone Model & Best Track Archive home page
Our model site displays National Hurricane Center (NHC) model data in Google Earth for active storms and areas of investigation. (Areas of investigation are designated as invests with numbers from 90 to 99.) You can also view model wind and pressure data, when available, in interactive charts. All best track and model data is archived so you can view historic data as well. Other features of our model system include NHC model error, a center fix system containing raw center fixes by satellite and other sources and model data for the East and Central Pacific basins. For active Atlantic storms, links to each storm's data will appear at the top of most of the pages on our site.
Example screenshot in Google Earth of Tropical Globe's National Hurricane Center model data of two invests in the Atlantic
If you have the free program Google Earth, you can access all the model data in the Atlantic Basin by saving the Google Earth file below:
This file will allow you to view the latest model data when it is available for active storms and areas of investigation. NHC best track, model and fix data come from the Automated Tropical Cyclone Forecasting (ATCF) system. Raw ATCF data is downloaded here from the NHC's FTP server and is processed by our site to be displayed visually when new data is available.
For a nice background to display Google Earth data on, click here for NASA Blue Marble imagery for Google Earth.
For information about other basins, visit Tropical Globe.
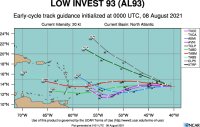
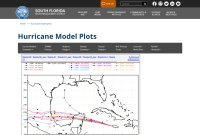
Example of early cycle guidance for storms in the Atlantic and East Pacific
Global model data available.
Global models:
NOAA (
GFS,
HAFS [Experimental]
),
ECMWF (IFS / HRES),CMC (GEM / GDPS),
UKMET (Unified Model / Global Atmospheric),
U.S. Navy (NAVGEM),and others
Global ensemble models:
NOAA (GEFS),
ECMWF (IFS / EPS),
CMC (GEM / GEPS),
UKMET (Unified Model / MOGREPS-G),
U.S. Navy(FNMOC Ensemble),
and ensemble means
Hurricane models:
NOAA (
HWRF,HMON
),
and other ATCF model guidance
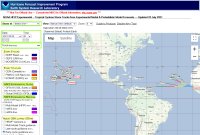
This experimental display, using Google Maps, contains model data for tropical cyclones around the world. It allows you to view global model ensemble members and means. It also contains some model data from the NHC's ATCF system.
Example of ECMWF ensemble, color coded by intensity, for two storms in the East Pacific
This display has some nice options that you can choose, but it can be a little difficult to navigate until you are familiar with it. You may need to click the left arrow under "Time" in the date and time section to go back to a previous run if you get a message about missing files.
To view the "Preferences" in the left column, you will likely need to click the heading for the "Track #Members" section to minimize that section so that you can view all the preferences available. If you don't, they will likely be outside of the viewing area on your screen. To view most of the model identifiers, which are not all shown by default, you need to select "Most" next to "Markers & Labels". One of the best features is to view the model tracks color coded by intensity. This can be found for the "Track Color" option. They can also be color coded by either 12 or 24 hour segments. The color legend on the map only applies when you select "Storm Intensity" in this dropdown box. You can also choose to simply view solid colors. You can also adjust the forecast length in this section. To view the "Observed Best Track" line with the models you are viewing, check that box in this section. To view clickable data points along the lines, choose an interval for the "Marker Frequency" option. To view all the clickable data points you will need to show most markers and labels.
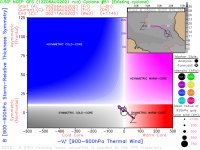
Example of GFS cyclone phase diagram for a low in the Atlantic
Global model data available.
Global models:
NOAA (GFS),CMC (GEM / GDPS),
UKMET (Unified Model / Global Atmospheric),
U.S. Navy (NAVGEM),JMA (GSM)
Global ensemble models:
NOAA (GEFS),CMC (GEM / GEPS),U.S. Navy (FNMOC Ensemble)
Hurricane models:
NOAA (HWRF, HMON)
This site goes into more depth about the forecast track of lows. It shows you the line where the center is expected to travel along with some pressure and other data expected at the core. The phase diagrams are a very valuable resource to look at to learn more about the core of potential and current storms. For information about how to interpret them, click here.
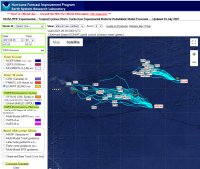
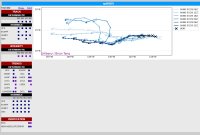
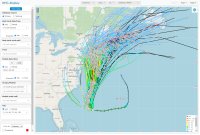
Example of GFS track trends for an invest in the East Pacific
This site has storm specific data, including track and intensity, for tropical cyclones globally. It has models from the NHC, as well as others, and includes some global model ensembles.
It also features track and intensity trends for NOAA (GFS), ECMWF (IFS / HRES), CMC (GEM / GDPS), UKMET (Unified Model / Global Atmospheric), HWRF, HMON and others using previous runs. For track trends, the current run and previous runs are mapped on the same image, as well as the storm's actual positions.
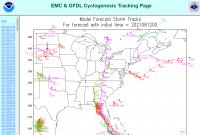
Example of model data page for a run on the NCEP / EMC Cyclone Tracks Page
Global models:
NOAA (GFS),CMC (GEM / GDPS),
UKMET (Unified Model / Global Atmospheric),
U.S. Navy (NAVGEM)
Global ensemble models:
NOAA (GEFS [listed as "NCEP Ens"]),CMC (GEM / GEPS),U.S. Navy (FNMOC Ensemble)
Hurricane models:
NOAA (NAM, SREF)
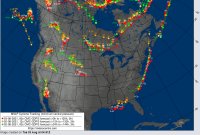
This site from NOAA's NCEP / EMC (Environmental Modeling Center) displays models' projected paths of low pressure areas all in one image. The images show the path of each low with a line and also display the forecast pressure along the path for North American imagery.
Example of multi model image for a model run
Once on the site, start by clicking the latest time in the left frame. If a model is only run every 12 hours (0Z and 12Z), you will never see the model appear on a 6Z or 18Z model page. You may need to go back a run to view model data for those models. Additionally, sometimes model data might not yet be available for a particular run. Some options are also not available for some models.
Once you click a run time in the left frame, in the right frame you will then see a page full of different regions and models. For the first table on the page, containing tracks for North America, you can select a variety of different views of, and around, parts of North America. The regions are listed on the left side of the table and include "U.S. East Coast", "Eastern North America" and "NW Atlantic" tracks. You can choose to view either a single run of data or choose a region that also says "(last 4 cycles)" to view the last four cycles on the same image. This can make for a very crowded image. Along the top of each table is a listing of the models available. Click a green check mark to access a model image corresponding to a particular region and model. A red "X" means model data is not available. While there are columns for ECMWF data, it is not publicly available on this site. (even when there is a green check mark) At the bottom of each table, the row "Text track file" has the model text data that is used to create the imagery. If you cannot read the pressure along the lines in the imagery for North America, you can try to find it in these raw text files.
The rest of the tables on the page are for the Atlantic, Eastern Pacific, Western Pacific, Indian Ocean and South Pacific. In those tables you only have the option to view a single view of that region. You can choose whether to view the latest run or the last four cycles. For some models you also have the ability to view genesis probabilities for a particular range of hours.
You can choose the "Multi Model" option to view multiple models on a single image. This includes the deterministic models, not ensembles. (GFS, but not GEFS members for example)
While you can view ensemble imagery on this site, the imagery will usually be extremely crowded, especially for North American imagery since it contains pressures as well. If you choose to then view the last four cycles as well, it will be extremely crowded.
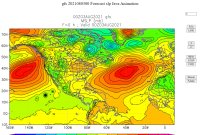
Example of Sea Level Pressure forecast imagery for the GFS from FSU's site
Global models:
NOAA (GFS),ECMWF (IFS / HRES),CMC (GEM / GDPS),U.S. Navy (NAVGEM)
Global ensemble models:
ECMWF (IFS / EPS Mean)
Hurricane models:
NOAA (HWRF, HMON)
This site has model imagery for the North Atlantic and Eastern North Pacific basins. It also includes part of the Central Pacific. You can select from up to about two dozen types of product types for each model.
Example of front page of NCAR's Tropical Cyclone Guidance Project
Global model data available.
-->
This site plots some of the National Hurricane Center's model track data from the ATCF system on images. It also displays model intensity data on other images. In addition to that data, it also adds other model data from other sources. It contains model data for storms worldwide.
Example of early-cycle track guidance for an invest in the Atlantic
They also have the latest SHIPS text output for a storm and links to other content.
There is an archive of imagery since 2005 for the Atlantic, East Pacific and Central Pacific and since 2011 for most other basins.
"This project was initiated and developed by Dr. Jonathan Vigh". NCAR is managed by the University Corporation for Atmospheric Research (UCAR).
NOAA (GEFS),
ECMWF (IFS / EPS [listed as "ECENS"])
Hurricane models:
NOAA (HWRF, HMON)
Regional models:
NOAA (
NAM,
HRRR,
WRF-ARW,
RAP
)
This site has model data that is kind of like Tropical Tidbits. First, select the model you want from the menu across the top. Then, select what region you want in the left column under "Other Regions". Under "Model Fields", you can select what kind of model data you want. There are a lot of options to choose from. This can be the base imagery that you select. To add additional overlays on top of the base data you chose, you can then select "Overlay". You can then select what data you want to overlay on the image by going back to "Model Fields". You can add more than one overlay, but the imagery could get very crowded depending on what you chose. You can loop the model data by selecting "Loop".
One of the really nice features of this site that differentiates it from most other sites is that you can zoom in on the imagery.
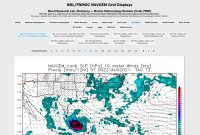
Example of HFIP's NHC Display with all the available model guidance for a storm, for a particular run, in which model lines are colored by forecast intensity
When available, and up-to-date, this site has a nice interactive display for model plots. The site can be a bit difficult to use though.
"The NHC-Display and Diagnostic system is an open-source web-based display and diagnostic tool to display hurricane forecast track and intensity (best track and model guidance) along with associated observed track information (fix information, wind radii, etc.) for real-time and historical storms for all basins. The display also allows users to compute consensus forecasts and display a limited number of gridded fields. (e.g., SST)." (quote from the page here)
To view model data, you need to select "Guidance" from the menu at the top that likely defaults to "Best track". You then need to select the storm you want. For many of the options that you change in the display you will need to click the "View tracks" button for the display to then update.
To view all of the model data you need to select all the models in the "Groups/Models" section in the left column. You can click on each group of model groups listed in that section and choose "Select all" for each group. You may need to select data from a previous run for models that only have data every 12 hours. To view models through a certain hour you choose, you can select the hours you would like to view model data for in the "TAU" section. There is also an option to color the model lines by intensity.
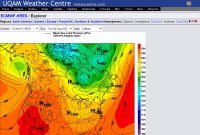
MeteoCentre.com - Hosted at the Université du Québec à Montréal (UQAM)
Example of MeteoCentre.com's ECMWF-HRES imagery for North America
Global models:
NOAA (GFS),ECMWF (IFS / HRES),CMC (GEM / GDPS),
UKMET (Unified Model / Global Atmospheric),
DWD (ICON),JMA (GSM),Meteo-France (ARPEGE)
Global ensemble models:
NOAA (GEFS),CMC (GEM / GEPS)
Regional models:
NOAA (NAM, SREF),
CMC
(
GEM / RDPS,GEM / REPS
)
Example of "Extra-Tropical and Tropical Cyclone Automated Tracking" from CMC (GEM / GDPS) for MSLP in North America on MeteoCentre.com's site
This site also has a lot of other various data, including surface data, satellite, radar, lightning and other data.
Their imagery is mostly focused on either North America or Europe and not specifically on the tropics. You can view their Northern Hemisphere imagery for a very wide view of much of the Atlantic basin.
For tropical cyclones, this site is best to use for storms near the Contiguous U.S. or Canada.
NOAA (GFS),ECMWF (IFS / HRES),CMC (GEM / GDPS),
UKMET (Unified Model / Global Atmospheric),
U.S. Navy (NAVGEM)
Global ensemble models:
NOAA (GEFS),CMC (GEM / GEPS)
Regional models:
NOAA (
NAM,
SREF,
HRRR
)
This site is mostly for North America. It contains a lot of various types of model products and other data, including satellite imagery. Some ECMWF and UKMET model data is also available.
Click here for their Tropical Atlantic e-WALL. (Notice in the left column the satellite views, including floaters.)
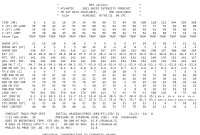
Text model data from the National Hurricane Center's ATCF System
Example of SHIPS intensity text output from NOAA's ATCF system for a tropical storm in the Atlantic
This folder contains a very detailed SHIPS text output. The latest files are at the bottom. Or, you can save this link which has the latest files at the top.
For more information about SHIPS you can visit the site here at Colorado State University.
Example of "aid_public" directory listing in NOAA's ATCF system
The compressed files in this folder contain the raw text data that Tropical Globe and other sites process to be able to display model data on a map and in charts. The easiest way to view this data is the processed output that our site and others generate. For more information about this folder, click here.
This site has NHC model data on single images for each storm. Ignore any storm that is not numbered from 1 to 49 for depressions or higher or 90 to 99 for invest areas.
This link is kept for posterity due to being available for such a long time online, before most any other model site was available online.
Other NOAA Sites
National Centers for Environmental Prediction (NCEP)
The National Hurricane Center has incorporated their NHC/TAFB Experimental Gridded Marine Forecasts into the proposed replacement of the National Weather Service Graphical Forecast Page. Select "Oceanic" as the geographic region and next to it select the forecast element you want to view, such as wind speed or wave heights. You can use the slider to view a different time period. You can learn more about how to use the interface here. You can view more information here on the NHC's site about the addition.
Hurricane Forecast Improvement Program (HFIP) - New Site | Old Site
"HFIP provides the basis for NOAA and other agencies to coordinate hurricane research needed to significantly improve guidance for hurricane track, intensity, and storm surge forecasts. It also engages and aligns the inter-agency and larger scientific community efforts towards addressing the challenges posed to improve hurricane forecasts. The goals of the HFIP are to improve the accuracy and reliability of hurricane forecasts; to extend lead time for hurricane forecasts with increased certainty; and to increase confidence in hurricane forecasts."
NOAA HFIP Related Websites - This site links to lots of great resources, some of which appear below and in other places on this page.
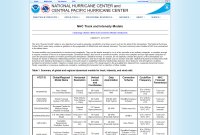
NHC Track and Intensity Models page
This page from the National Hurricane Center explains some of the different models used in forecasting hurricanes. It explains the differences between dynamical, statistical and statistical-dynamical models, explains the difference between early and late cycle models, as well as provides detailed tables about some of the models they use. It contains information about what particular ensemble members might exist in a consensus model. The page may not always be up to date, so be sure to check the date the information was last updated.
Annual NHC verification reports also contain additional model information. You may find information about what ensemble members existed in a consensus model in the past.
For a more complete listing of most model names that are used in the ATCF system, check the NHC's "techlist" files here. Our site has a model listing page here that combines some of the information from these sources.
Hurricane FAQ from NOAA's Atlantic Oceanographic and Meteorological Laboratory
NOAA AOML's Hurricane FAQ page
We directly link above to the answer on the page to the question "What Are the Current Hurricane Track and Intensity Models?". You'll find a lot of other informative information on that Frequently Asked Questions page.
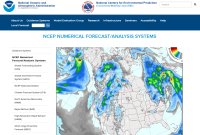
NCEP Numerical Forecast / Analysis Systems home page at EMC
This site links to the various model systems at NCEP, including GFS, GEFS, NAM, RAP, HRRR, SREF, HWRF, HMON and others.
In addition to linking to model data, you can also find additional information about the various models.